Visualization of text and edition
1. Why visualize?
Have talked over the past week about editions and their models: how we create them, how we manage the data, how we model it, how we query and transform it. I want to come back to the human interfaces to that data - how we visualize it - and talk about all the different choices one might make when setting out to do this.
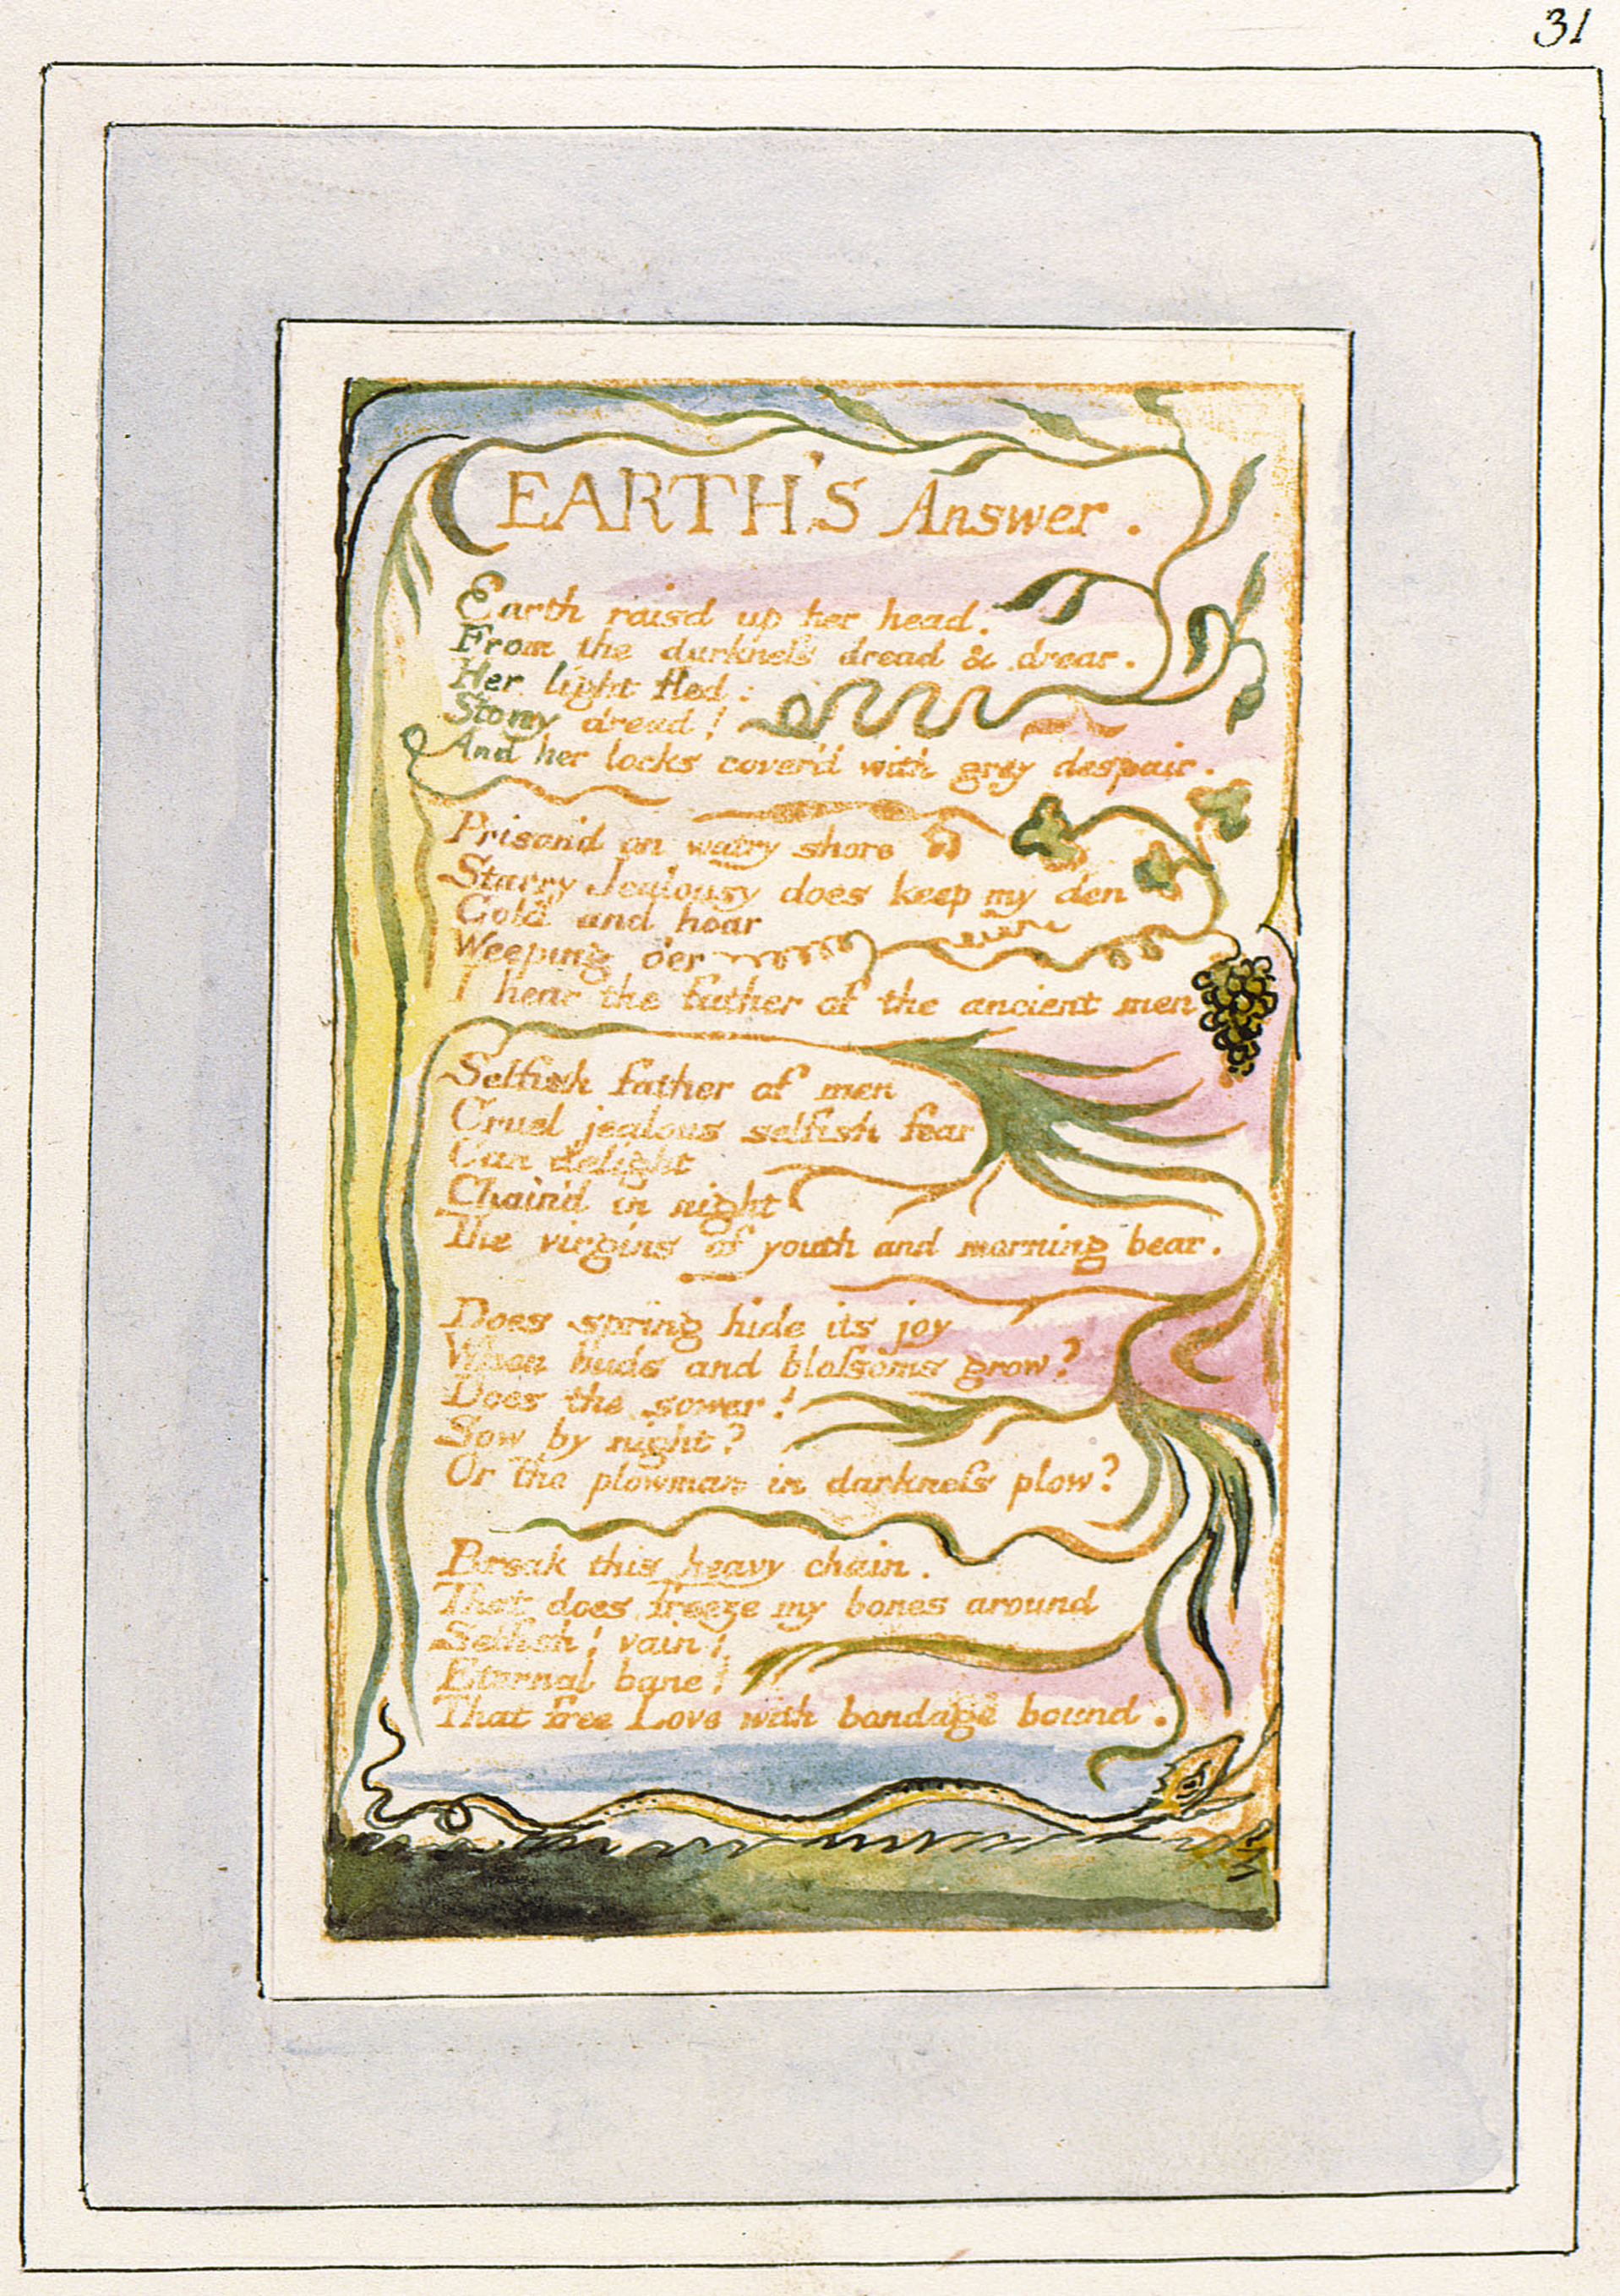
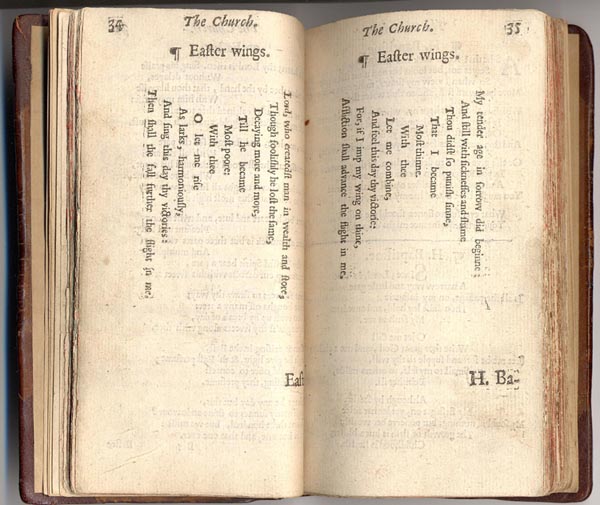
Question 1: does text have an inherent visual form? Question 2: might a particular text have an inherent visual form?
You’ve spent the last day learning about, and concentrating on, APIs. Now it is perhaps time to admit that there is a raging debate in the field over the relative place of APIs vs. graphical user interfaces on digital editions. On the one hand, if you create an elaborate user interface through which a reader is supposed exclusively to access your edition, is that not putting barriers in the way of scholars who are interested in incorporating your text and data in ways that you might not have foreseen? On the other hand, is presentation, visual choice, and even stylesheet design not a form of rhetoric, or of argument?
We can look at some examples of interfaces and what stories they are trying to tell.
We can also consider the use of software that is intended to produce a standard interface for a critical edition, such as EVT or Ediarum.
Some editions produced with Ediarum:
- http://edition-humboldt.de/index.xql
- http://schleiermacher-in-berlin.bbaw.de/index.xql
- http://cagb-db.bbaw.de/index.xql
An edition produced with EVT:
These packages have the obvious advantage that they are meant to take the place of a publishing house, in that they have “house styles” for layout, font, organisation of information, and so on. But they also carry a major disadvantage, which is that it becomes very easy to close yourself off from the possibility of making your own
2. Talk lab: what does your text look like?
Now that you have planned out the API for your edition, think about how you personally might use that API to show the user something. Will it be a reading text? Will it have notes of any form, or hyperlinks? Can the contents of the notes be expressed pictorially, or as some other form of data structure?
3. Visualizations, transformation, and manipulation
At this point I’m going to show you around an edition that I made, experimentally, a few years ago, and walk through the choices I made, why, and let you tell me what might be even better. You can follow along here.
Next I will talk a little more about the variant graph as a visualization for those of you who are dealing with texts in multiple versions, and how we can adapt the graph and manipulate it in the browser.
4. Code lab: using Graphviz
Much to my great regret, there are so very many choices to be made concerning visualization that we can’t cover all possibilities. Since we have been discussing graphs over the last few days, and since you all now have the Graphviz software installed, and since some of you have been asking what a serialization of a graph looks like, we will experiment with making graphs to finish this session.
In order to run the notebook you will need to execute the following commands:
pip install graphviz
pip install git+https://github.com/tla/ipython-hierarchymagic.git
The graphviz module is simpler and less capable than the pygraphviz module that CollateX uses, but has the advantage that it installs without trouble on Windows!